Compare any player in the league against another: metrics, quality of play, handicap trends, performance on shared courses, and an AI prediction of who'd win a match today.
Select two players from your league and get the full analysis instantly
A complete statistical showdown
Pick two players from your competition and the app generates a comparison in seconds across four sections: performance by the numbers, quality of their rounds, handicap trends side by side, courses where both have played — down to hole-by-hole detail — and a prediction with the factors that would tip the match toward one or the other. You can look at it over the current season or the entire history.
① Metrics compared
Head to head numbers
Overall performance and league performance.
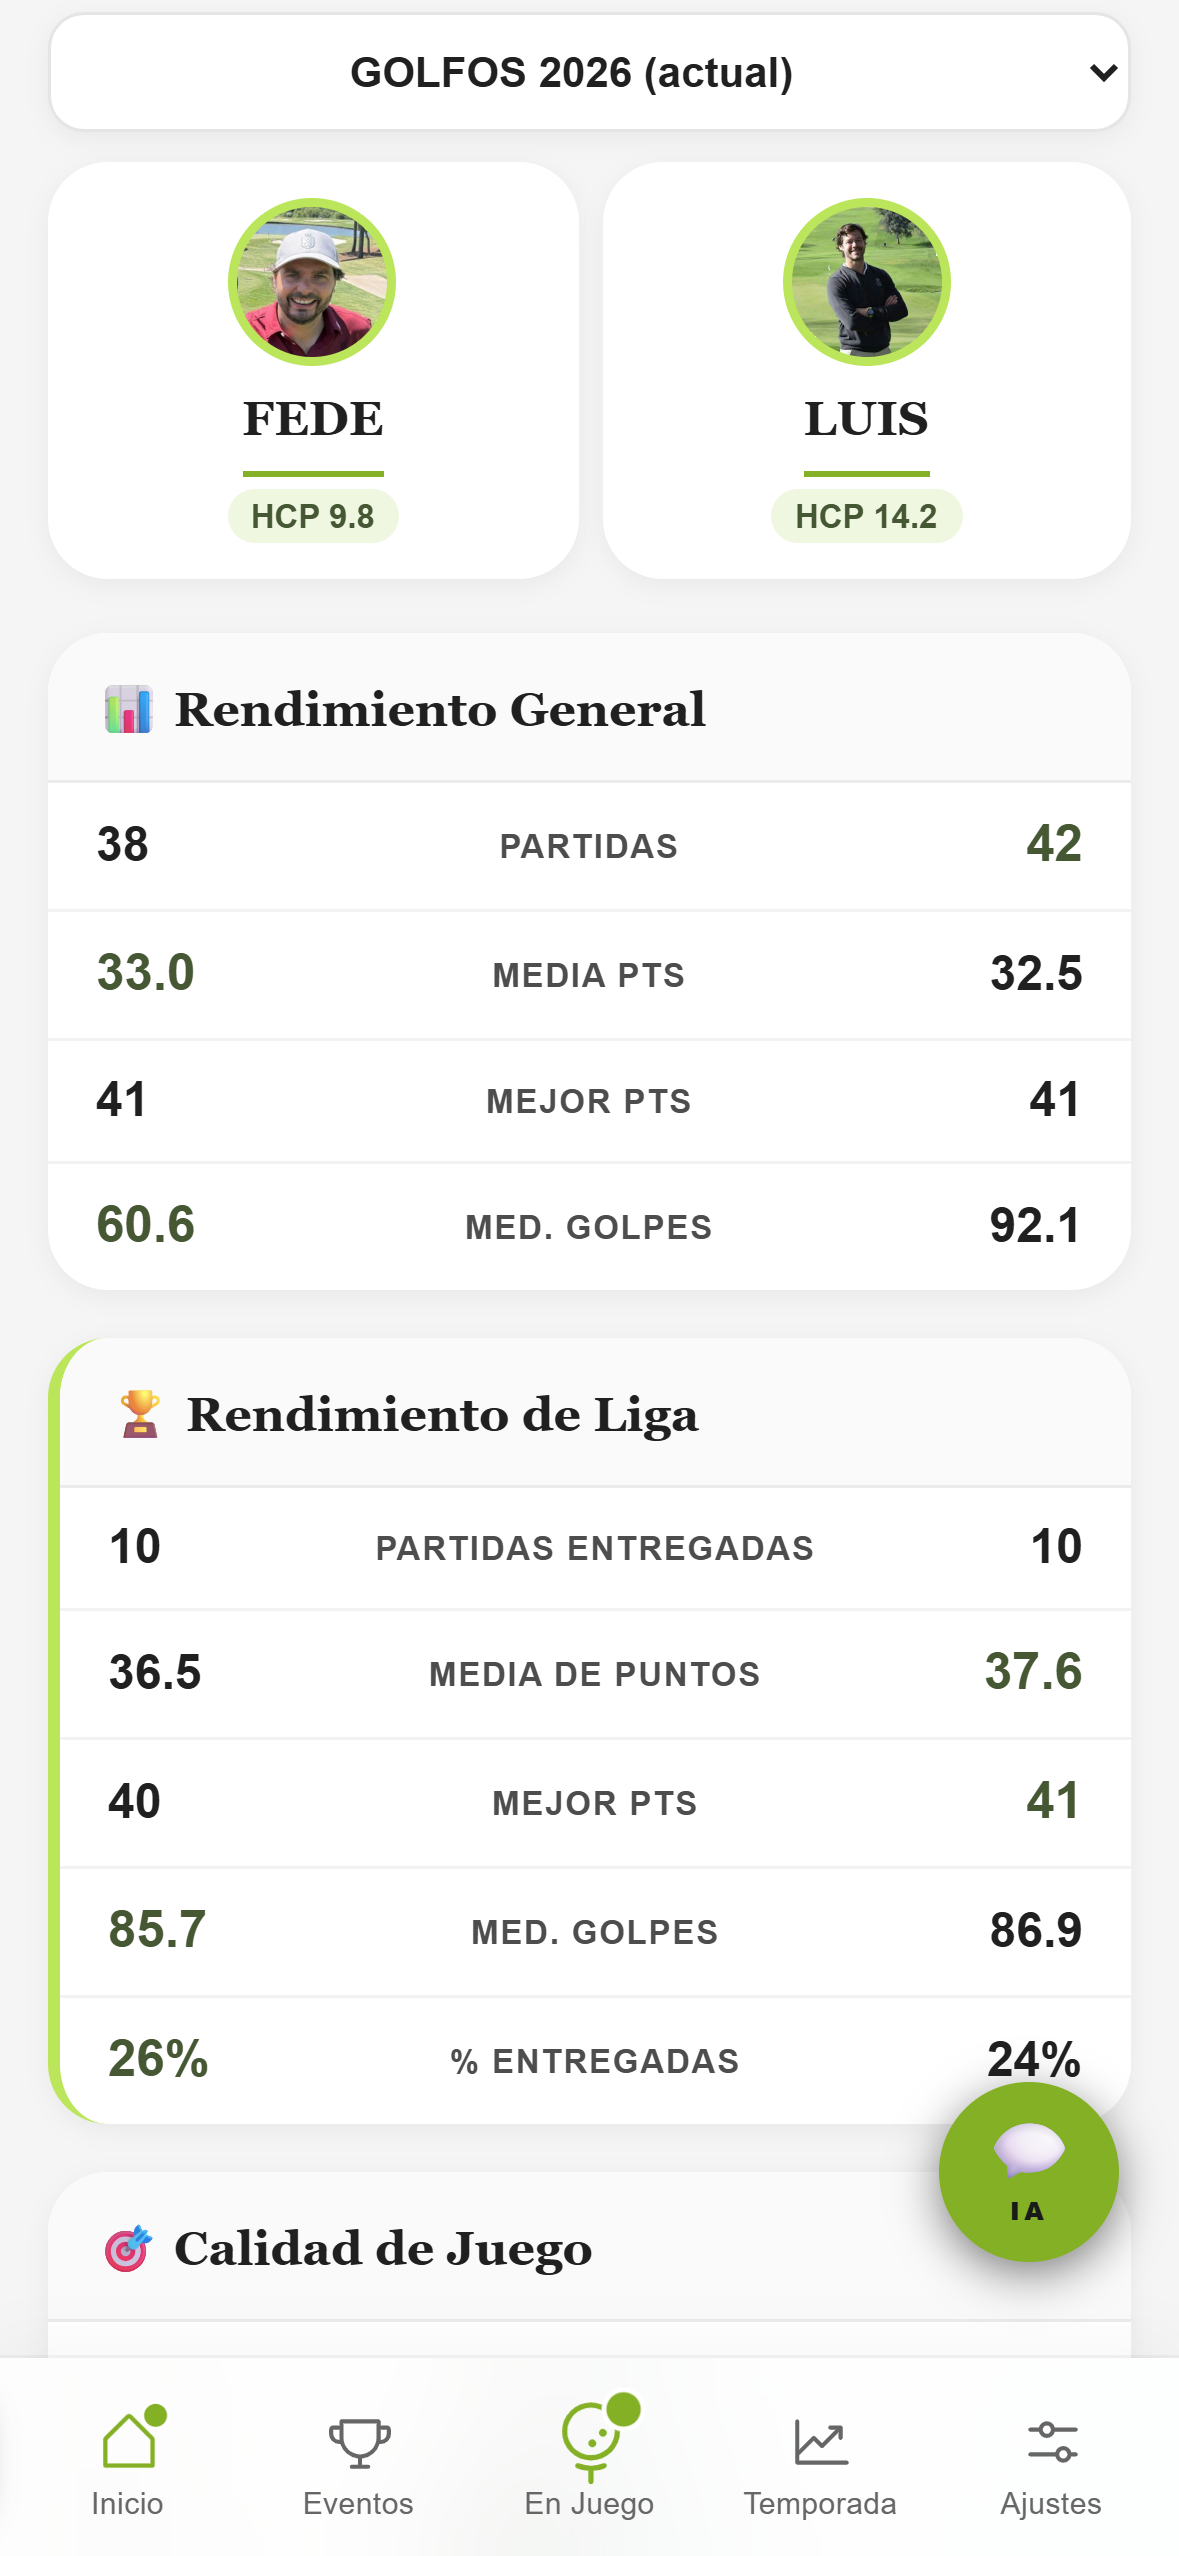
Both players' metrics in two columns. Every number compares directly: whichever is in green is the better of the two on that metric.
Overall performance — rounds played, average points, best score, average strokes. Includes every round, submitted or not.
League performance — the same metrics filtered to only cards submitted for the ranking, plus the submission rate (rounds that counted toward the ranking vs. total played).
The submission rate reveals who makes the most of their rounds for the ranking — a player can play less but submit more and rank higher.
② Quality of play and handicap trends
Consistency · Handicap side by side
Who's more consistent?
Two complementary analyses that go beyond the average: how rounds break down between good and bad, and how each player's handicap has evolved over time.
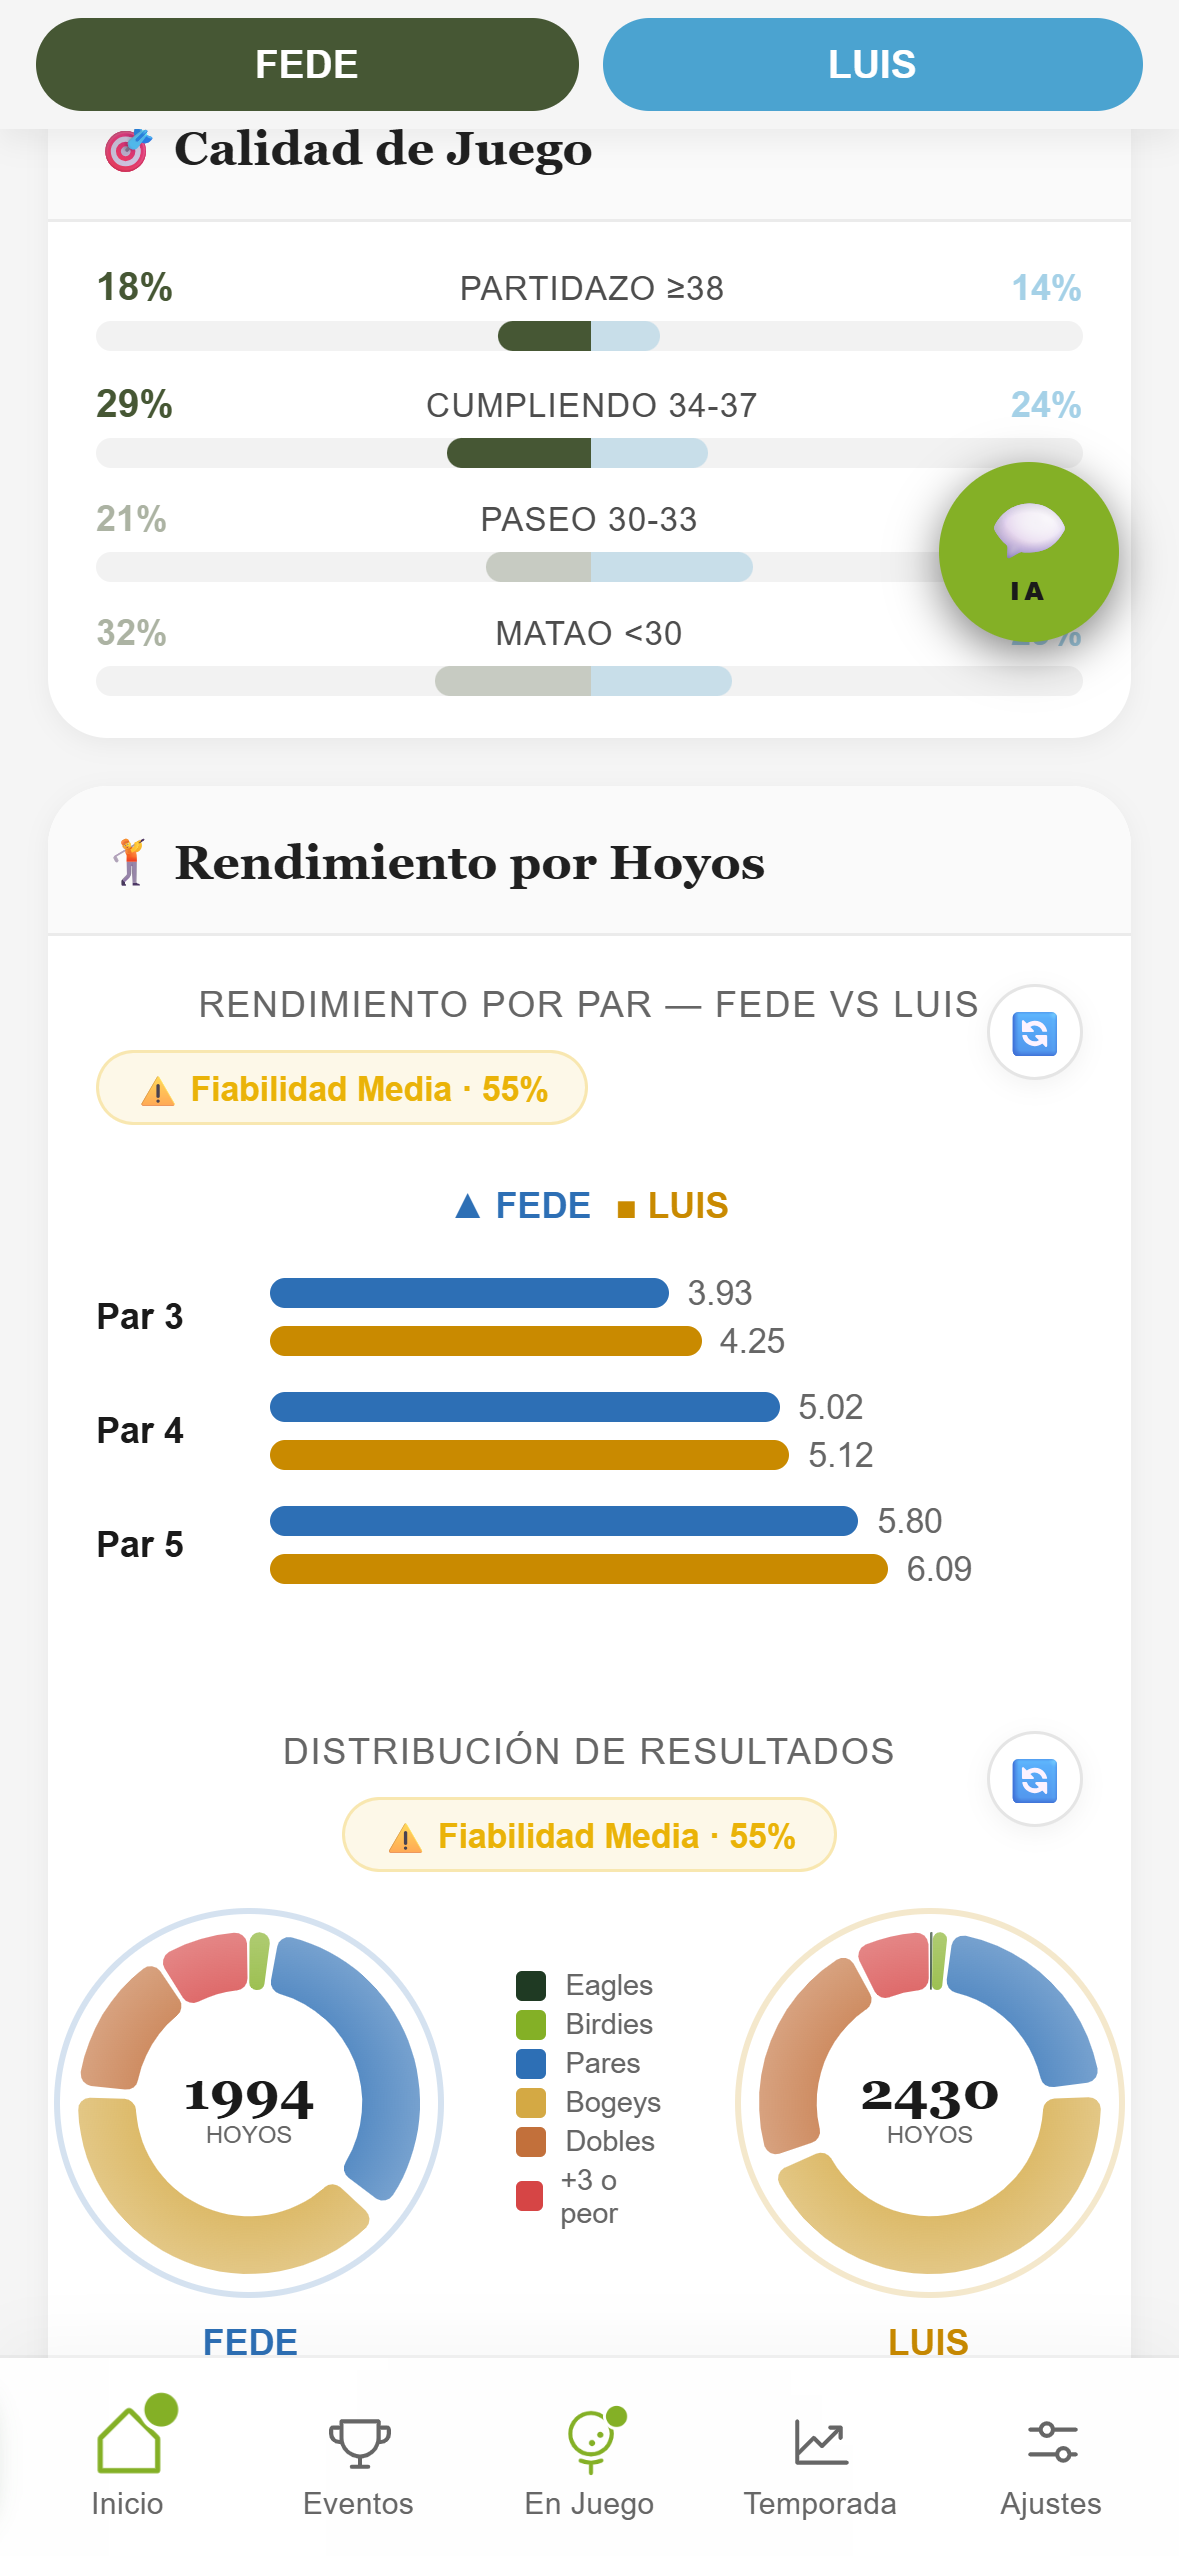
Quality of play — rounds broken into 4 categories with comparative bars: Great round (≥38 pts), Solid (34-37), Stroll (30-33) and Rough day (<30). The higher the % in Great round, the better.
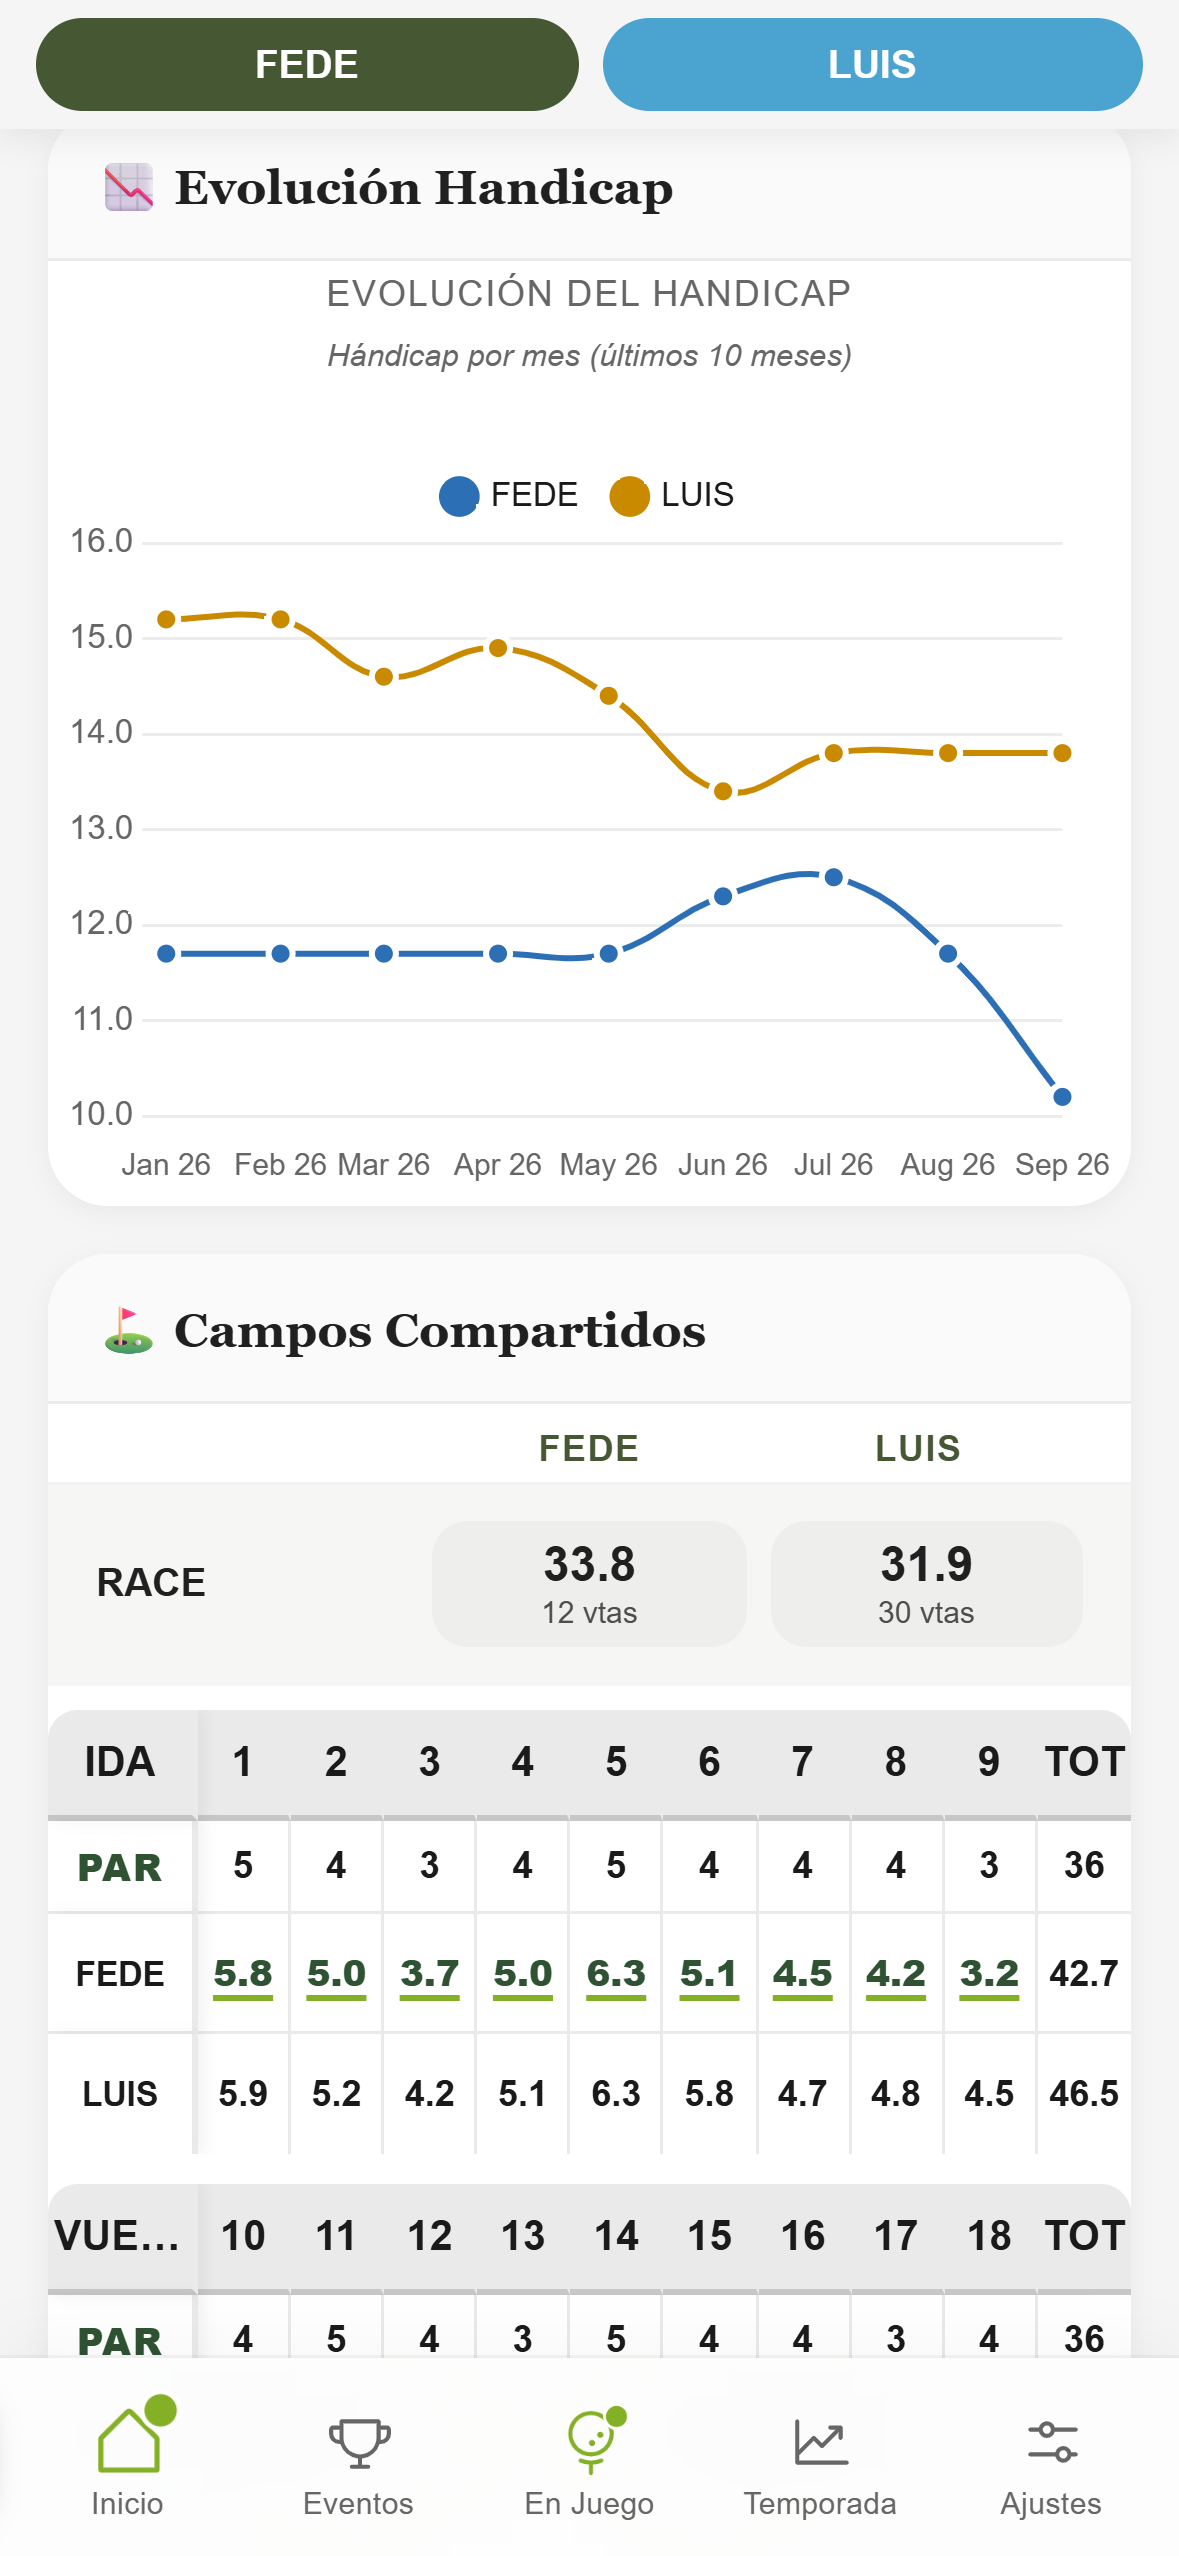
Handicap trend — a dual-line chart with both players' WHS index round by round. Each line has its own color, so you can see who's improving faster and who's more stable.
③ Shared courses and AI prediction
Common ground · Who'd win today
On the courses where they overlap, who dominates?
The comparison wraps up with two especially telling sections: performance on courses where both have played, and an AI prediction of who'd score more points if they played today.
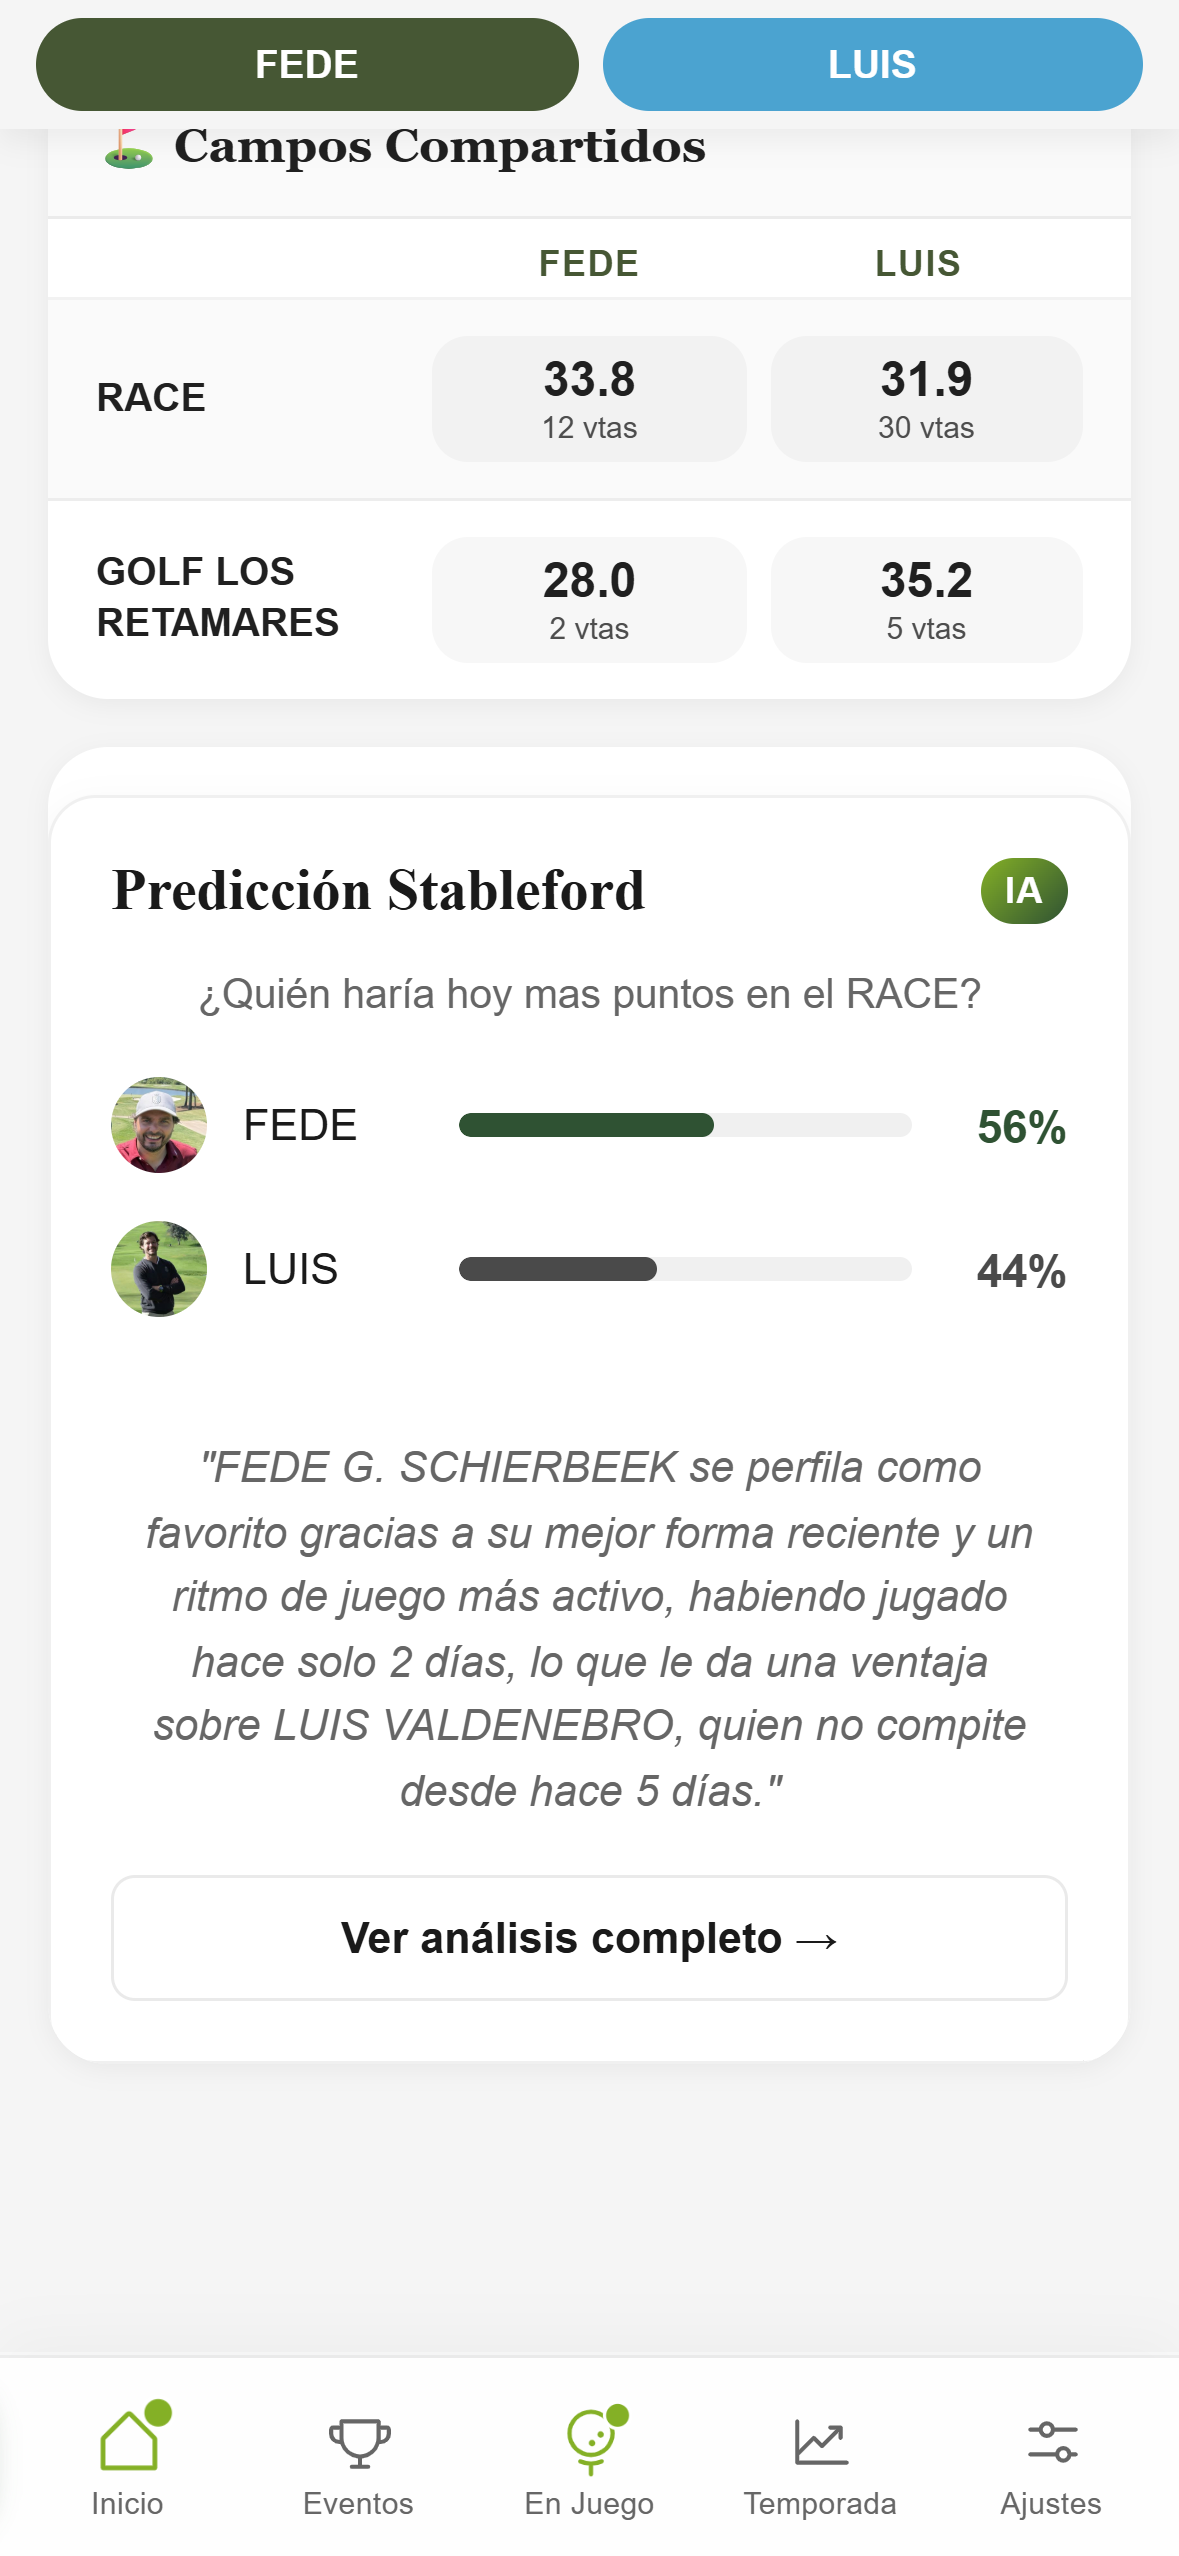
Shared courses — each player's average points on courses where both have history. Direct context on the terrain they both know.
And hole by hole — expand any shared course and a scorecard appears with each player's average strokes on every hole, split front and back nine. Each average is color-coded as birdie, par or bogey average, with a gradient for values in between. That's where you see exactly which hole they beat you on.
Stableford prediction — each player's win probability (e.g. 66% vs 34%) calculated by AI from both players' history. Includes a written explanation of the main reason for the edge.
The prediction carries a confidence level depending on how much history is available for each player. More rounds means more precision.
④ Why the AI sees it that way
AI · With a confidence level
Not just a percentage. The reasoning too.
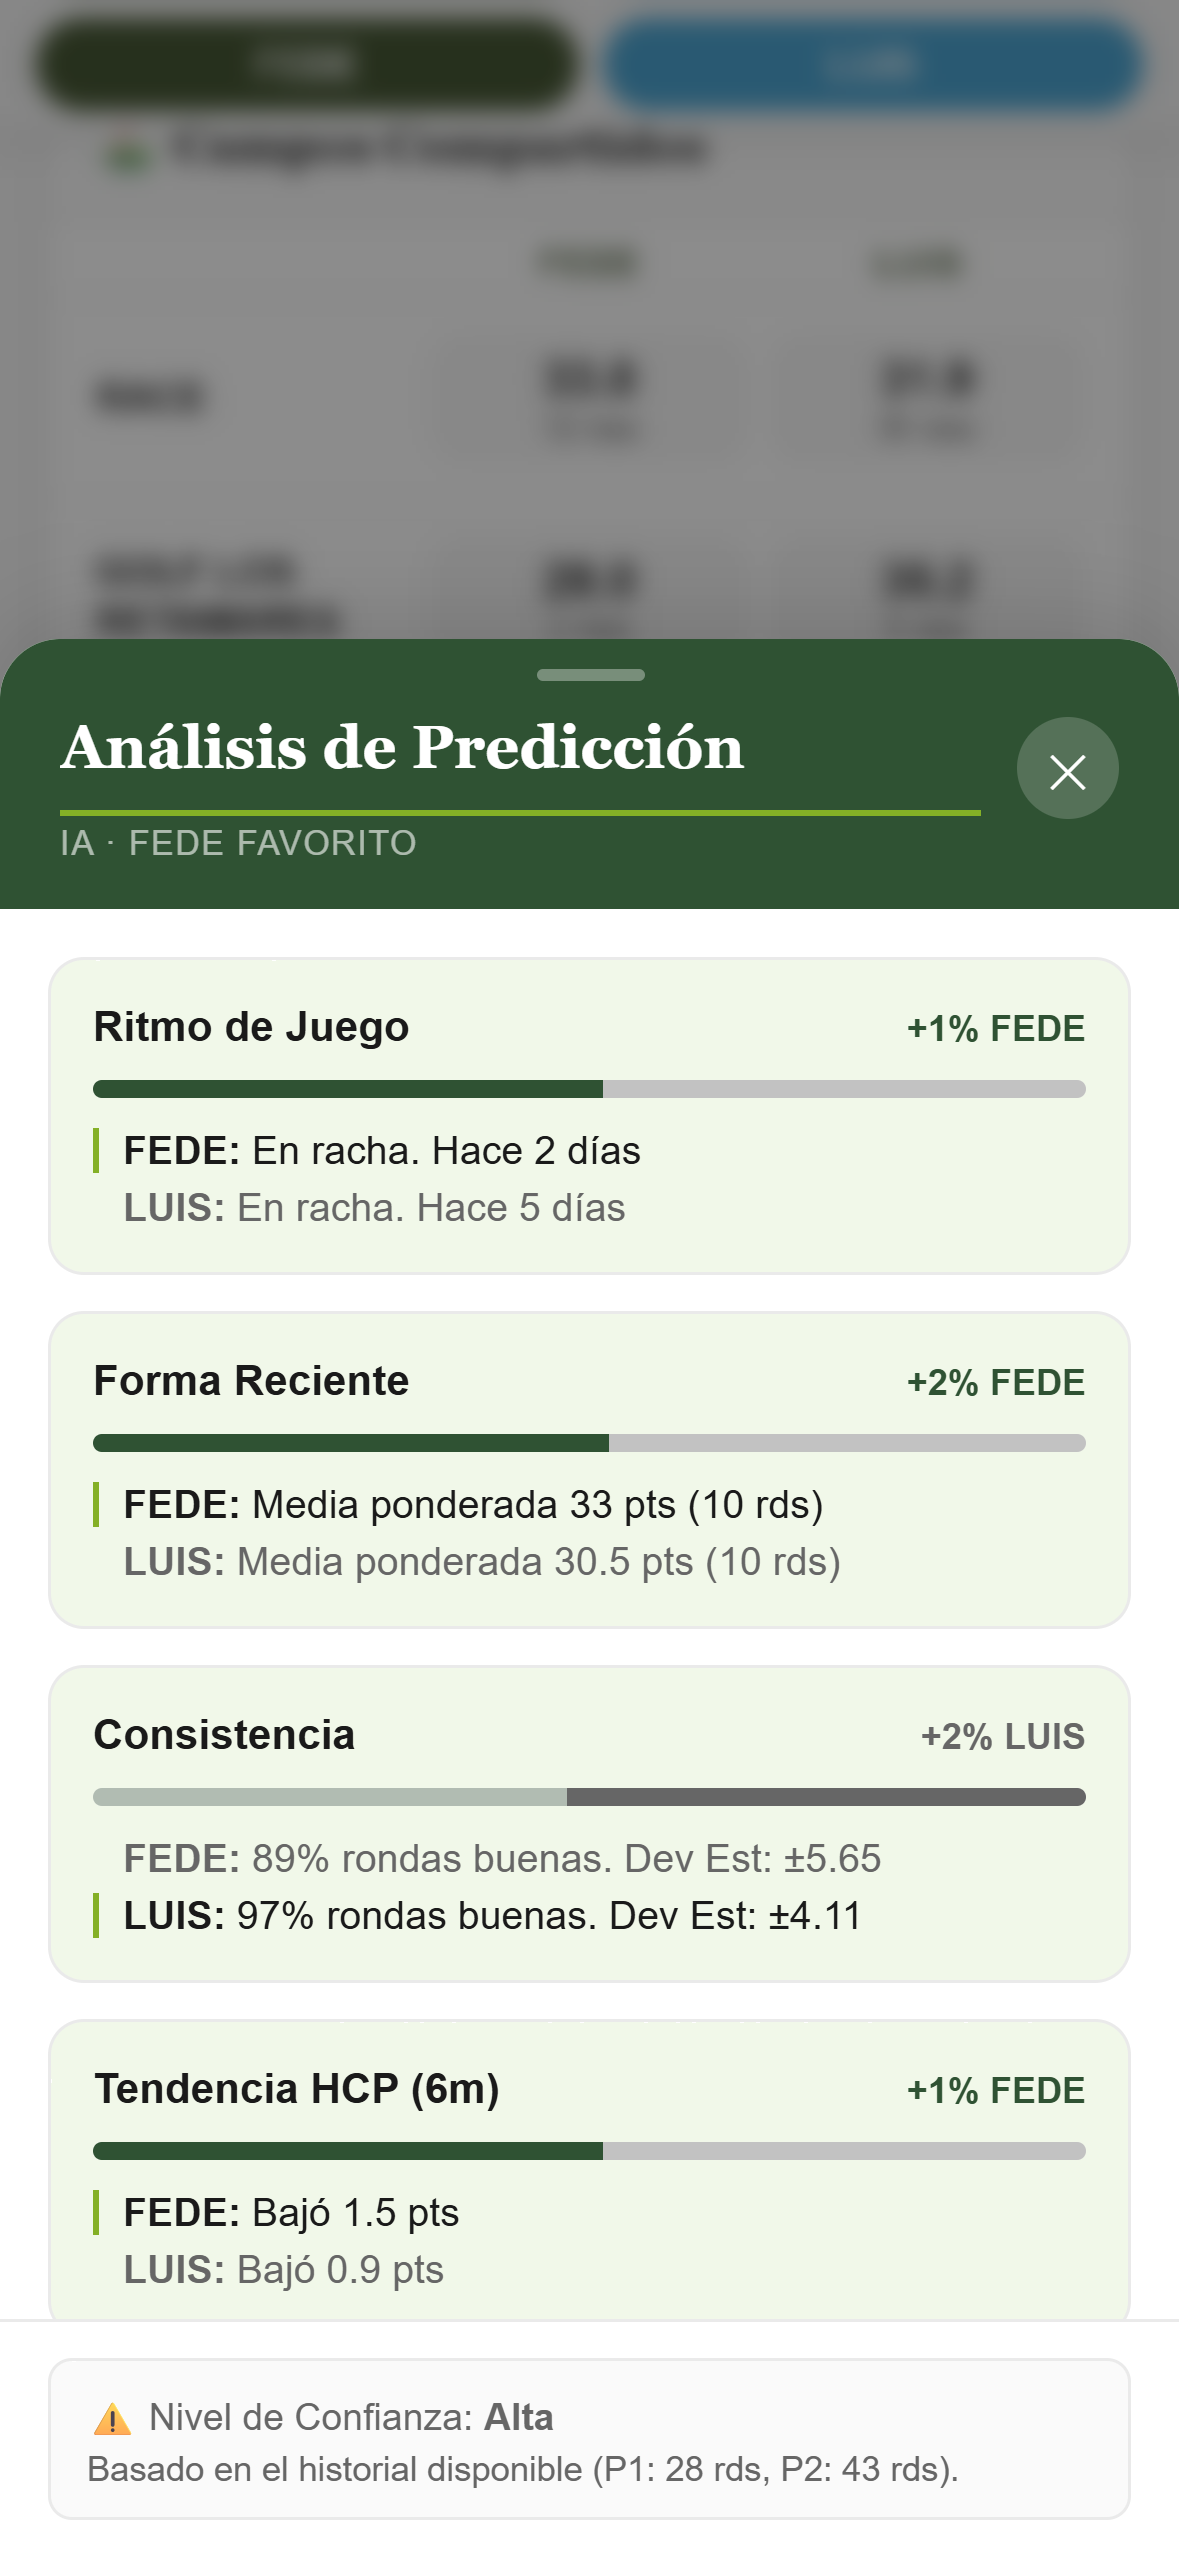
Tapping "See full analysis" expands the reasoning behind the forecast: which variables favor each player and which one weighs the most in the outcome. Here are the main ones the AI takes into account.
Recent form
How each player has been playing in their latest rounds.
Course history
How each player performs on that specific course.
Consistency
Who's steady and who swings between great rounds and bad ones.
Handicap trend
Whether it's improving or has been stuck for a while.
Head-to-head
What's happened the times these two have played each other.
Pace and competitiveness
How often each one plays and how they respond when something's on the line.
The panel shows a confidence level (High / Medium / Low) based on each player's history. With fewer than 5 rounds, the model flags it explicitly.
Let the data talk before the excuses do.
The comparison and the prediction are available for any player in your league, at any time.